Financial compliance advisory
Recovering a Google Ads landing page from a 49 to a 96 PageSpeed score
A performance-only Webflow audit and fix pass across two priority pages, run against explicit PageSpeed Insights targets and retested in the same session.
Visit live website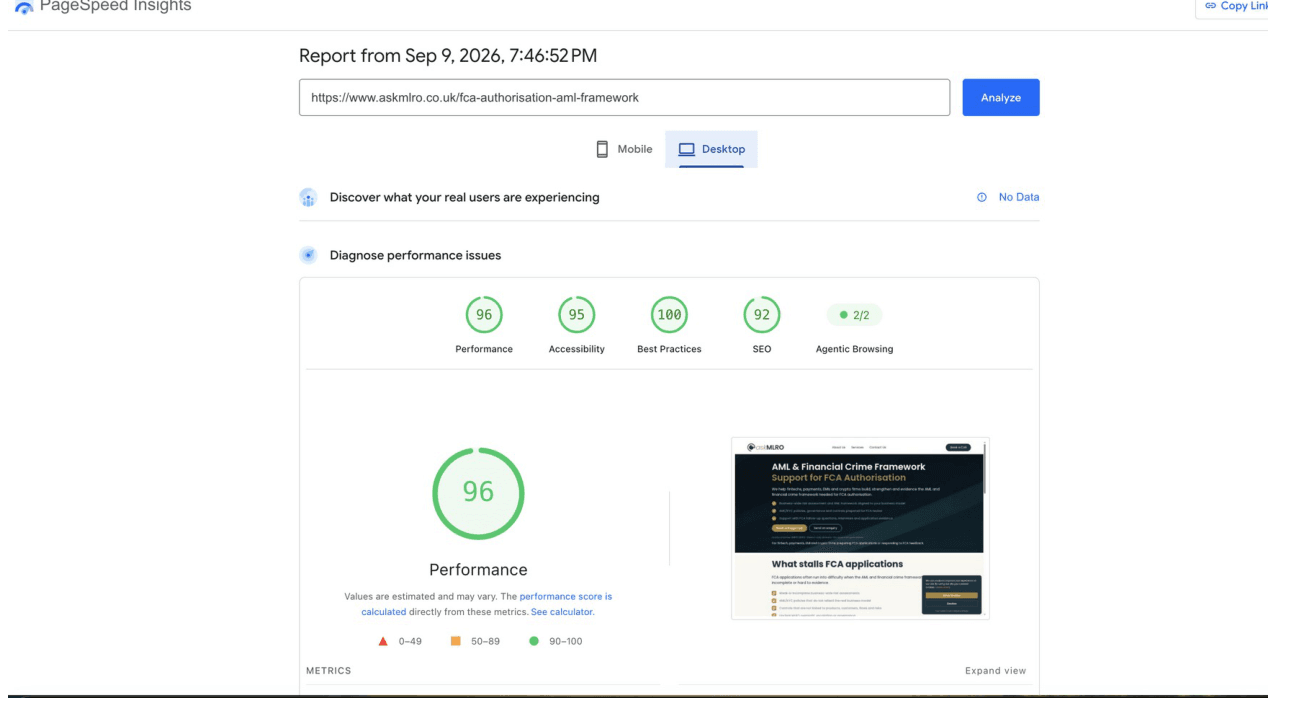
- Client
- askMLRO
- Pages in scope
- Homepage, FCA Authorisation AML landing page
- Engagement type
- Performance-only pass, no redesign
- Baseline source
- Client-supplied PageSpeed Insights at project start
- Retest
- Google PageSpeed Insights, September 9, 2026
- Regression check
- GTM, GA4, and Google Ads tracking verified after every fix
- Core Web Vitals audit
- Google Ads landing page experience
- Image optimization (WebP conversion)
- Render-blocking script remediation
- Third-party script debugging
- GTM/GA4/Ads regression testing
A landing page Google Ads itself had flagged
askMLRO is a boutique AML and financial-crime compliance advisory for fintechs, PSPs, EMIs, crypto, and RegTech companies. Its FCA Authorisation AML landing page carries paid Google Ads traffic, and Google Ads had marked it with a "Below Average Landing Page Experience" rating.
The brief was narrow and explicit: audit and fix the homepage and that landing page against clear PageSpeed Insights targets (mobile 80+, desktop 90+, TBT under 200ms where feasible) — without a material redesign, and without breaking existing tracking.
What the audit actually found
The baseline PSI figures showed the FCA landing page desktop score at 49 — the worst of the four page/device combinations audited — driven by a Total Blocking Time of 1,810ms, roughly 3.2s of JavaScript execution, and 15 long tasks on the main thread.
The root causes were concrete, not vague: render-blocking CSS/JS from Webflow's shared stylesheet, webflow.js, and a full jQuery 3.5.1 bundle (an estimated 1,680–1,800ms of blocking time); unoptimized images (the single largest opportunity, up to ~1.25MB on the homepage desktop); unused JavaScript being downloaded and parsed regardless; more preconnect hints than were actually helping; and a third-party cookie-consent script (Elfsight) invoking a parser-blocking cross-site request via document.write, alongside a 404 on its own visitor-token endpoint.
- Baseline PSI audit across 2 pages × 2 devices
- Root-cause list, not just a score
- Elfsight script issue traced to a specific 404 and a parser-blocking request
- Explicit, numeric targets set before any fix shipped
The fix pass, and what it actually moved
The fixes matched the diagnosis: every image asset was converted to WebP and re-uploaded; hero images on both pages got fetchpriority="high" since they were the LCP element on each page; JavaScript was set to load asynchronously instead of blocking render; and the Elfsight cookie-consent issue was resolved and confirmed clear in the browser console.
Retested in the same session, all four page/device combinations met or exceeded their targets — including the FCA landing page on desktop, which moved from 49 to 96. No layout, copy, or tracking changes were made; this was a performance-only pass, and GTM, GA4, and Google Ads Conversion Tracking were all re-verified afterward with zero misfires.
One thing this case study does not claim: exact after-fix LCP/TBT millisecond figures. The after-test screenshots captured the overall Performance score but not the expanded metrics breakdown, so that remains a recommended follow-up rather than a number invented for this page.
A dated technical snapshot
Google PageSpeed Insights, both pages, both devices, same session — September 9, 2026
Before figures are the client-supplied PSI baseline at project start; after figures are a same-session retest. The after-test screenshots captured the overall Performance score but not the expanded FCP/LCP/TBT breakdown — a follow-up PSI run with the METRICS section visible is the outstanding step for logging exact millisecond figures.
Mobile
- Homepage
- 68 → 86 (target 80+)
- FCA landing page
- 64 → 86 (target 80+)
Desktop
- Homepage
- 85 → 92 (target 90+)
- FCA landing page
- 49 → 96 (target 90+)
Build a clearer Webflow system.
Send your website, Figma file, or product brief. I will review the current structure and recommend the most useful next step.
Start a project